So You Want To Build A Sports Betting Model
My College Basketball Journey
Published on March 21, 2024
Background and How I Got Into This
I think it’s important to begin with the fact that I am not a die hard sports fan. If you were to pick a random college basketball team, I would have a hard time naming one player on it. I often hear that sports fans and gambling fanatics find sports betting as the perfect marriage of the two. That was not the case for me. I will watch the big sporting events, but prior to beginning this project the idea of gambling on sports was comical to me.
This journey began my junior year of college. I was a Statistics and Computer Science major and my main (academic) interests were in Machine Learning. It was common knowledge that you had to have a project on your resume, and I had spent some time during the previous summer developing models as part of an internship. I also experimented with modeling in a few kaggle (an online Data Science community) competitions. That winter break, with everything shut down by covid and my boredom at its peak, all that any of my friends and I were talking about was Illinois Basketball. Following a tough first year performance and a much improved second year under new coach Brad Underwood, the Illini were shaping up to be a serious championship contender. Sports betting had been legalized in Illinois just 6 months prior, and it seemed all that anyone wanted to do was bet on the Illini. However, betting on Illinois college athletics within the state of Illinois is not allowed. I remember hearing about some girls driving across the border to Indiana to place a bet on the Illini to win the national championship. I couldn’t believe it! People really wanted to bet on sports – my friends included. I recall reading some of the conversations my friends were having about betting and thinking it was some of the greatest pseudoscience that had ever been spoken into existence. Surely I could build a model that could outsmart them? Little did I know how deep one could go into the world of sports modeling.
Data Aggregation, Cleaning, and Model Building
I was determined to build a model and to do it fast. The first step I took was to try and find some data. I had experience scraping data from some of my previous projects but this was the first time I had to really search for quality data to scrape. At the time, all I really knew about basketball I would hear about from ESPN or the occasional Illini game. I knew the basic basketball statistics and betting terminology, but I was very green. I remember searching for data and finding basic box scores on ESPN, but the data was not cleanly organized and did not go back as far as I needed. Eventually, I stumbled upon a site very similar to Ken Pomeroy's Kenpom, a well known often cited source for advanced analytics within college basketball, with the added benefits that all the stats were provided free of charge and had data going back all the way to 2008. The site was "barttorviks T-Rank", and looking back, it is hard to think that I would have continued on with this project had I not discovered this site.
I had done some scraping before but nothing of this scale. It was a tedious process at first. After many consultations with stack overflow, I put together a somewhat usable scraper for the site. It's funny to look back at how I approached this problem, and I really wonder how I kept track of everything. At the time, all of my code was stored inside a single jupyter notebook file. There were minimal functions and the majority of the work was done within large for-loops that at the end would write pandas dataframes to CSVs. It was naive, slow, and error-prone but it worked.
The site introduced me to more statistics than I could keep track of, but I didn't have time to learn them, nor did I really care. The season was underway, and I was racing to get a model out the door to show off to my friends that I could beat them with math.
The real challenge in this first crack at building a basketball model was transforming the data into something I could feed into a machine learning model. I initially settled on an approach that is not too far off from what I have today. I took every single statistic available and treated each game as Team_A vs. Team_B. For each team, I would have statistics that were essentially rolling weighted averages of their respective statistics. Each training data point was Team_A_Stat_x, Team_B_Stat_x, where x was one of 30+ statistics. Each stat was calculated using all games in the current season, up to the one where Team_A and Team_B played. Then, I merged information related to the court, encoded with Team_A being home, away, or neutral. After this, I had what looked like a not so awful dataset.
Here is a simplified example using Illinois vs. Penn State on Dec. 5th, where we will predict the win or loss margin of Team_A. Let's say Illinois is Team_A, Penn State is Team_B, and Illinois is the home team. For my statistics let's just use [3 Pt. %, EFG, Adjusted Tempo, Court]. So I would take the current 3Pt %, EFG and Adjusted Tempo for each team, calculated using all the games they have played, prior to the date of the game - Dec. 5th in this case. For court, I had 3 encoded variables - Team_A_Home, Team_A_Away, Neutral. In this instance Team_A_Home would be a 1, and the others would be a 0. I then feed these features into a regression model and predict the win/loss margin. So if the model spit out -2. That would mean that I am predicting Illinois to lose by 2.
This first year, my model only contained team level data with statistics that were provided through the one site. I tried a few feature selection methods, trimmed off some highly correlated features, set up a pipeline to scale features, then tested a handful of different machine learning models and found the one with the lowest MAE. It wasn’t great, but I was in a rush and it seemed to get the job done.
The final step was to get the model predicting on current data. This is where my process really struggled. I had never had to “productionize” a machine learning model. So what I settled for was a loop that each day would scrape the games from the previous day and append them to CSV files containing the previous data. Then, I would jump a cell down and rerun my processing functions. Finally, I would have a dataset that I would retrain the entire model with. It was a relatively small dataset (sub 100k rows with maybe 50 features or so), so training was quick. I would then predict the current day's games. Afterwards I found betting odds for the day's games. Finally I would put my predictions on a spreadsheet along with the betting lines for the games and use some conditional highlighting to tag “good” bets, ones where my predictions deviated from the betting lines by 2 points or more.
I still have the google sheet in my drive:
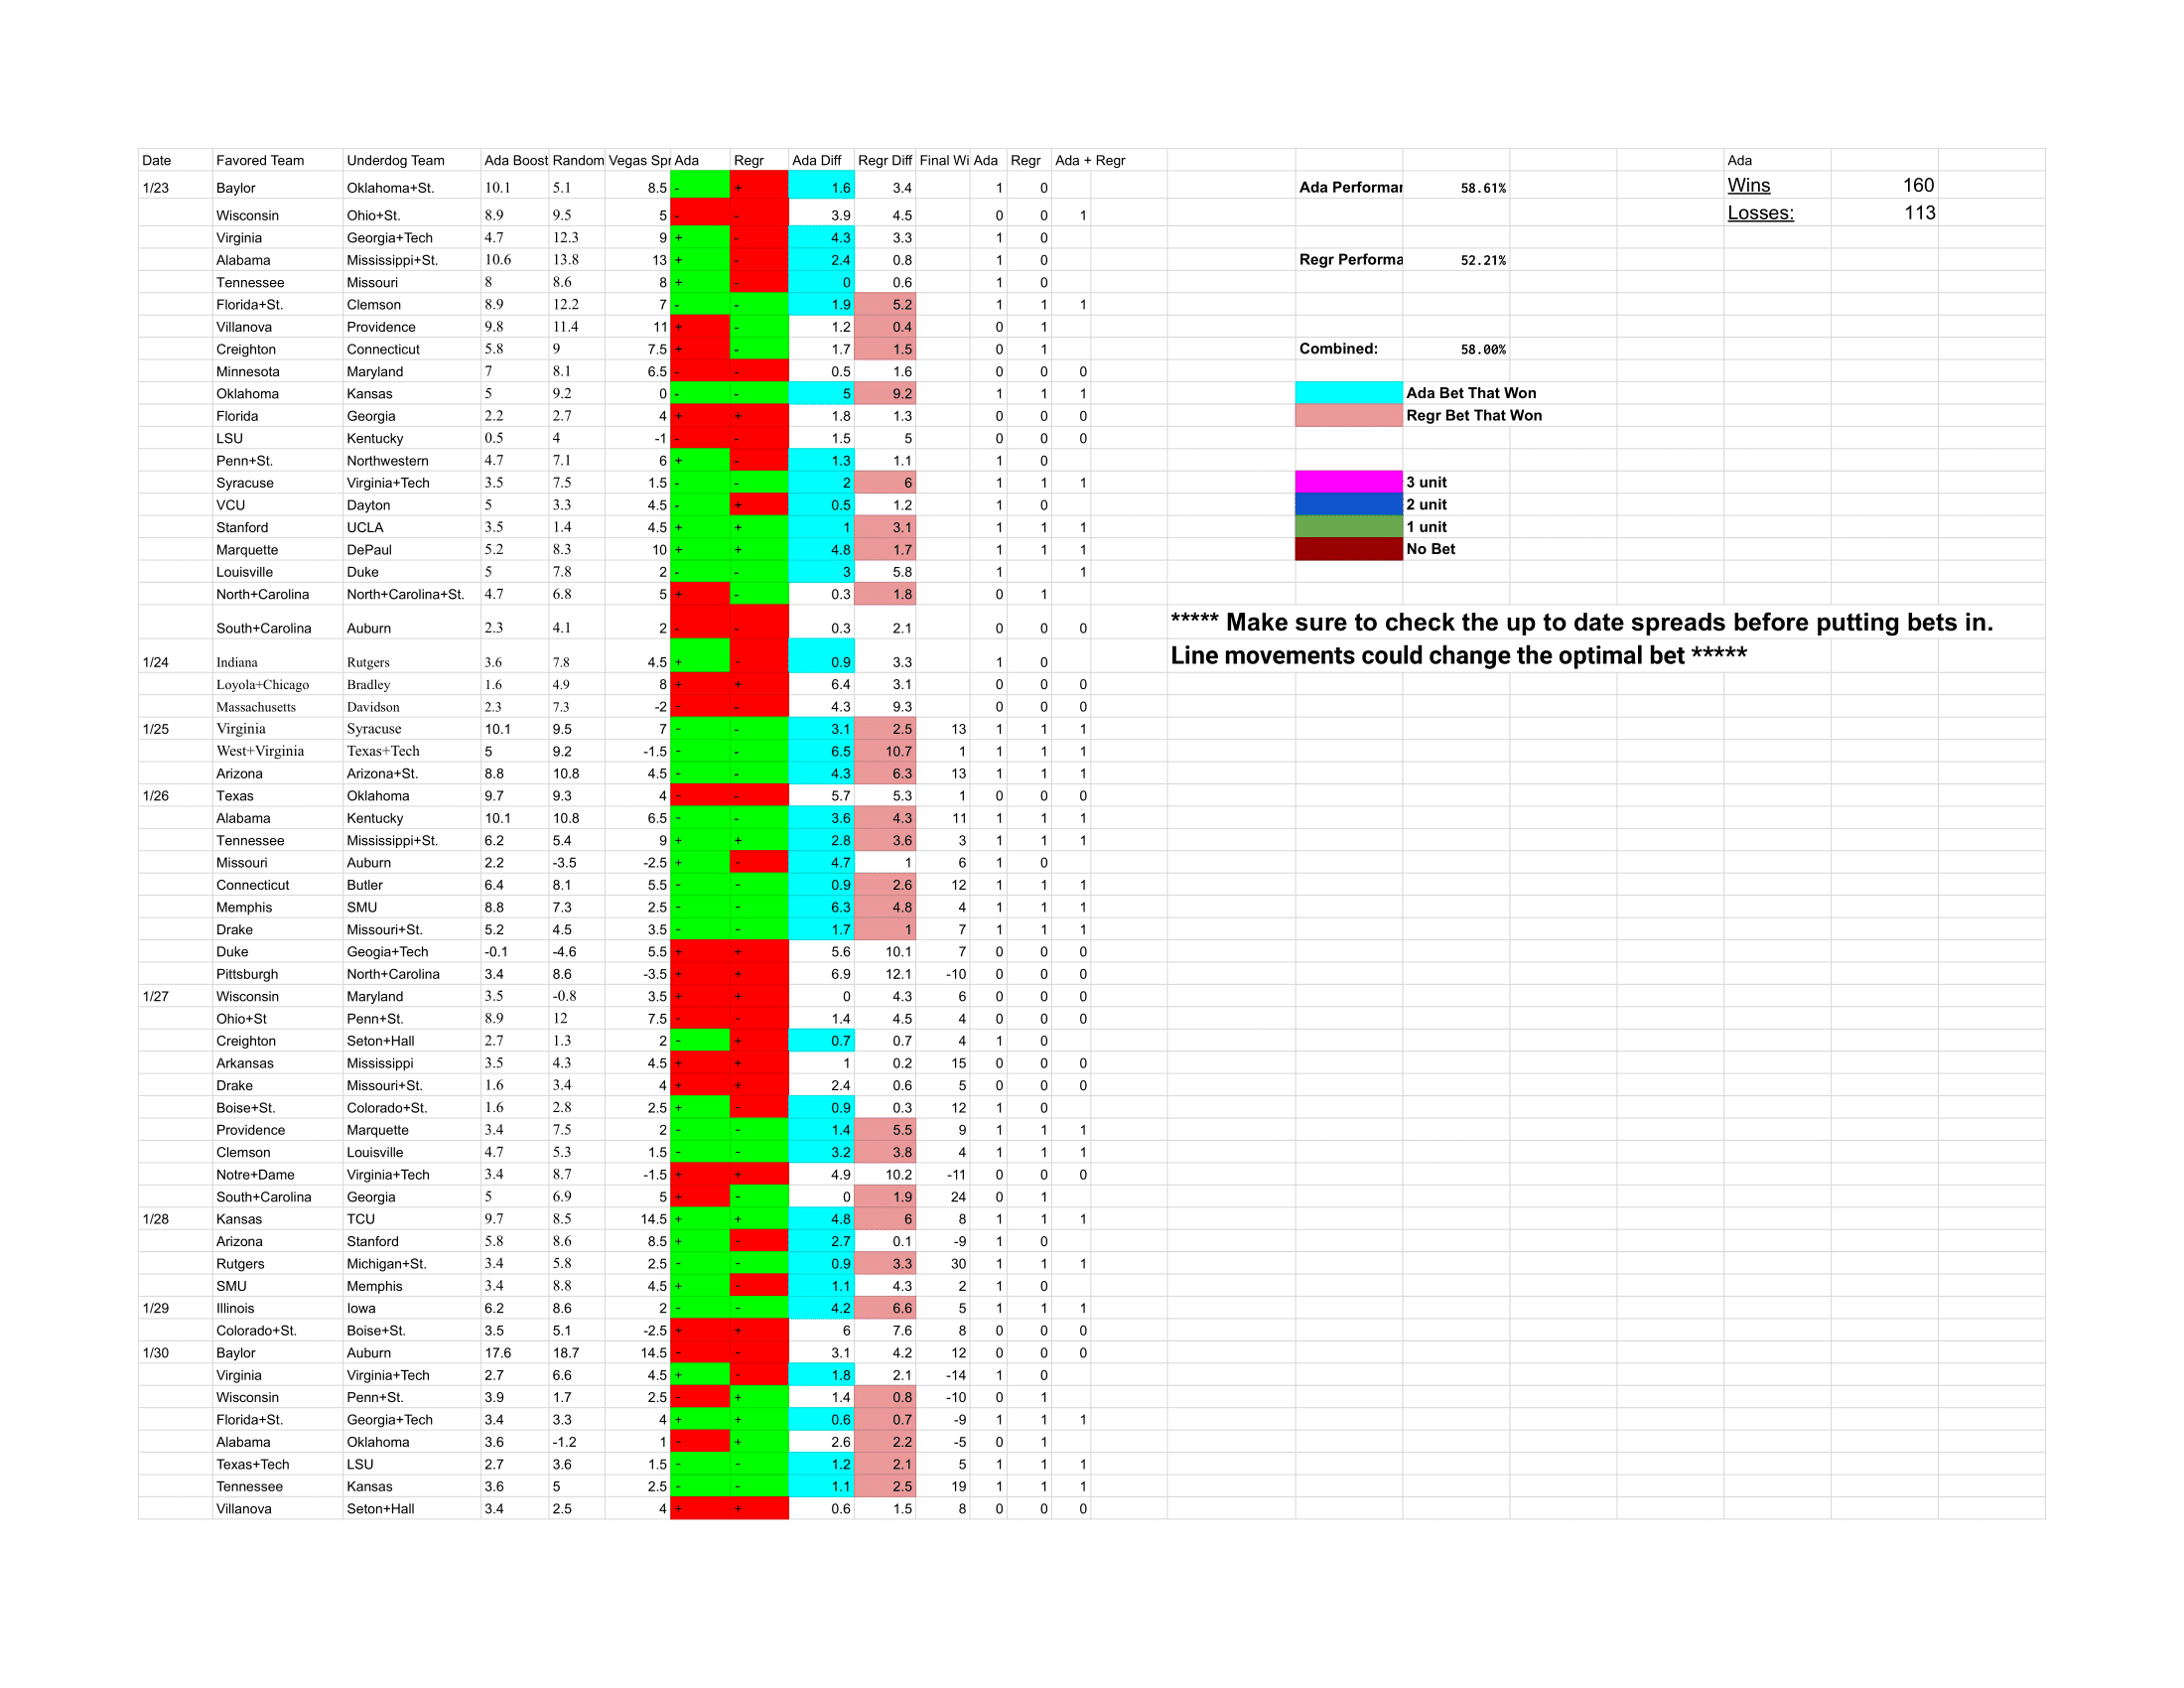
You can see the model did surprisingly well given the simplicity of the whole thing. I had multiple models running and trusted the Adaboost the most. In this case multiple models refers to different types of machine learning algorithms. In the sheet I include Adaboost and Random Forest. These models used the same features, but different strategies to arrive at their final prediction.
Given what I know now, I can almost certainly chalk the performance of that season up to positive variance. Looking back, I see how valuable of a learning experience it was to struggle through this initial year and the subsequent seasons. Keep in mind, this was before ChatGPT, and it required a tremendous amount of trial and error to get merges and processing right. It was also the relative beginning of my engineering career, and I was learning a great deal every day that I worked on this.
So now I had half a college basketball season under my belt, and a rough understanding of what was required to build out a sports betting model. However, I knew there was so much I could improve on.
A significant amount of time and effort was invested after the first season. Having laid out the transition from idea to model, I now want to highlight the most important parts of the journey over the subsequent 3 years.
First, I needed a way to get historical betting data into my training data. I quickly realized that traditional error metrics (RMSE, MAE, …) were only so great. It was really much more important to gauge performance against betting lines. I was able to find some free historical betting data online and then began what was the first of many painful integrations of betting data with my historical game data. The real issue here is naming. There was no consistent naming schema across data sources. Over the years, I ended up using what I call a ‘source of truth’ naming. Each time I stumble across a new data source, the first step in data processing is a manual naming match from the new data source to my ‘source of truth’. To give some context, there are around ~360 division one college basketball teams, and each year you might gain or lose an additional couple of teams, there is also the occasional name change.
As an example, my "source of truth" name for the University of Illinois, is "Illinois Fighting Illini". I had one dataset with Illinois referenced as "UIUC", one as "University of Illinois", and one with just "the Fighting Illini". Take this type of problem, multiply it by 360, and then multiply it again by the number of datasets you are using and you have encountered the first of many headaches in building a sports betting model. This is just for team based data - player name spelling can be an even larger headache. Luckily I found a good source for player data and only had to merge two player data sources.
So now I had some betting data. I trained my models again and set up some custom validation functions to test performance against betting lines. What do I see?
If you are familiar with sports betting pricing and terminology you can skip the below section
It will be useful to understand some basic sports betting terminology. While initially my models were designed to predict the win/loss margin of Team_A vs. Team_B, I quickly developed a total model as well. The amount a team will win or lose by is called a point spread. Betting operators provide point spreads for games with the basic idea being that they are providing a market to wager on whether a team will win by greater than or less than a certain number. Here is an example where Illinois is playing Penn State. Draftkings is offering a market of Illinois -5 at -110. That means that they are offering you Illinois to win by 5, where to win $100 you must wager $110. If Illinois wins by more than 5 you win the bet, but if they win by less than 5 or lose the game, your bet loses. You can also bet on Penn State +5 -110. So you are wagering $110 to win $100 if Penn State wins, or loses by less than 5 points. If the game ends and Illinois wins by 5, that game is graded a “Push” and your money is returned regardless of which side you bet on.
Similarly, you can also wager on a total. That is whether the combined point total of the two teams will be greater than or less than a certain number. If the total is 140, and you bet the over, a game that ends with 145 total points will be graded a win. If you bet under it will be a loss. If the game ends at 140 both sides are graded a Push.
To keep things simple let's just work under the assumption that point spreads and total markets are priced at -110. That means the book believes there is a true probability of 50% that the score ends with Illinois winning by 5, and a 50% chance that the total score of the game is 140. If both sides of a market are priced at -110, we say that the sports book is charging a 10 cent vig on each side. So the true price of the market is 50% or +100, but they are charging a couple percent to house the wager, this is one of many reasons sports books are at an advantage to your average bettor.
** Note this is not necessarily the case and there is a lot of nuance to pricing markets and oftentimes sports books take positions on games, really what these numbers represent are the median outcomes of the game, but they are happy to take more money on one side of a market i.e. take a position on a game**
Another way to look at what that -110 price means is that in order to break even betting on totals and point spreads, you need to win 52.38% of your wagers (assuming you bet a flat amount on each bet).
-
I saw a whole lot of break even money, if not losses. This is when I started to realize this sports betting thing might be a bit more difficult than I first anticipated.
I think it's important to note, that there are significantly easier ways to make money betting on sports, and that I really only dove headfirst into an originating methodology (the process of creating your own numbers for games) because I didn’t know there was any other way to approach it.
What kept me going and working on this problem was seeing the work I put in slowly but surely start to drop those error metrics. Watching the theoretical returns that I soon came to obsess over, creeping towards a positive number, was a huge motivator as well. I want to call out what I think were the real needle movers when it came to turning my model into something that can beat the market.
Establishing a testing and validation framework that I could rely on was the most important piece of this whole puzzle. Working with this framework I could quickly iterate on various ideas, knowing immediately if the idea would improve my model or not.
To give you an idea of what I mean, here is the type of granularity in my experimentation that I was looking for:
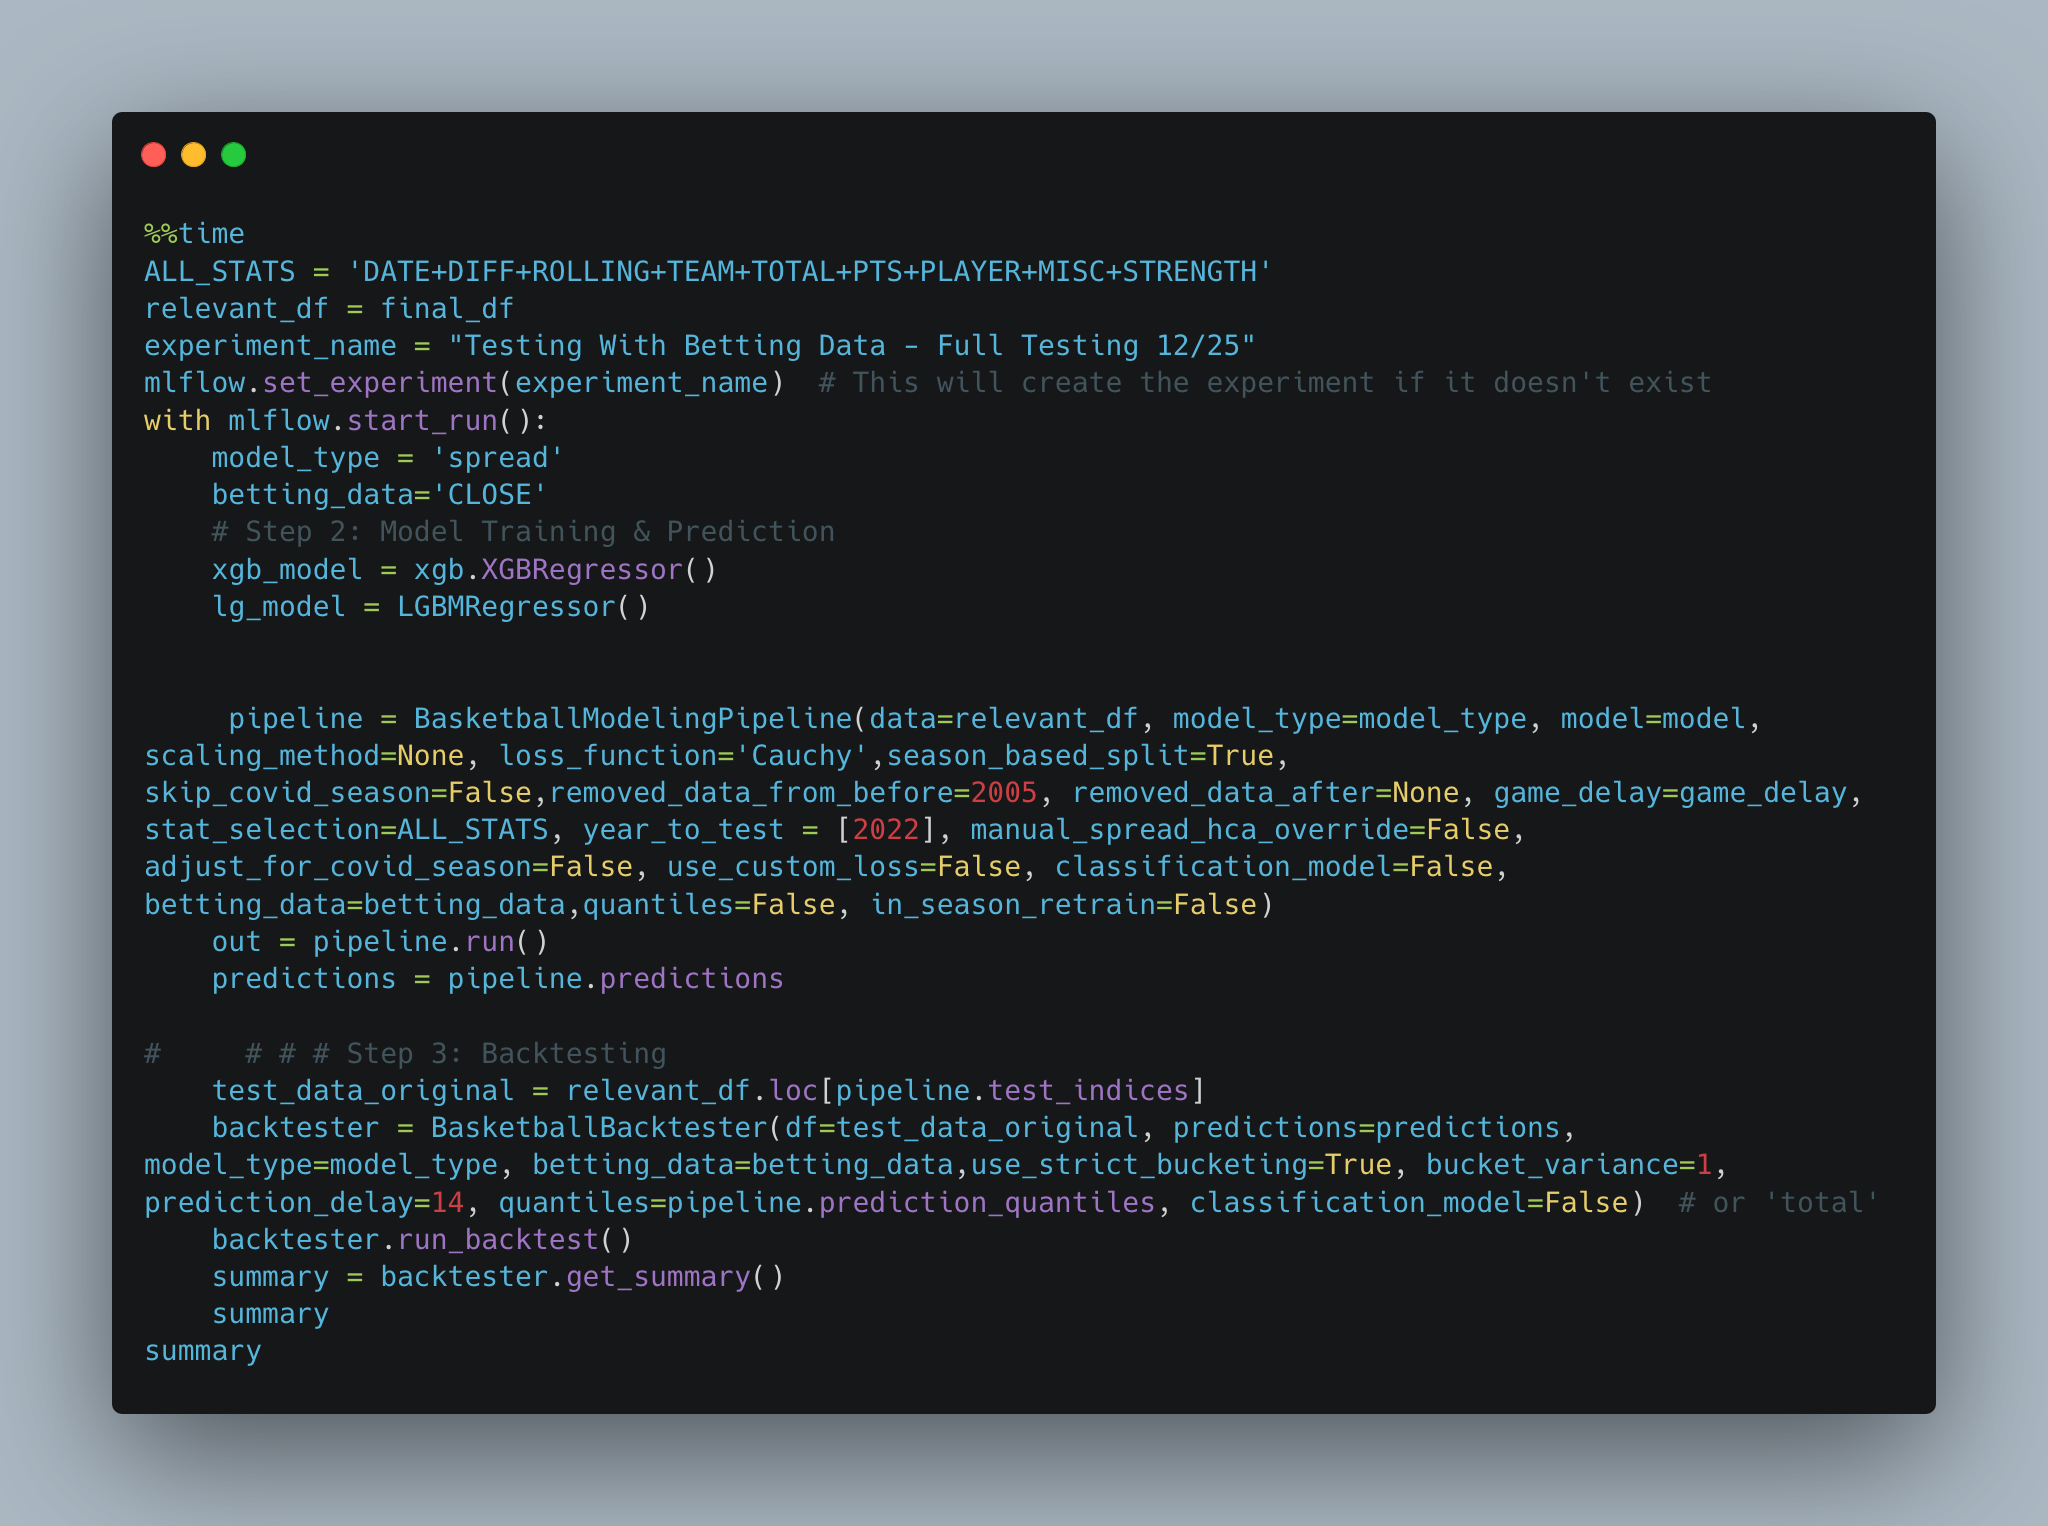
Each experiment was tracked in MLFLOW. The classes above became an easily configurable playground for me to try adjusting various parts of the pipeline all within a single cell.
The reality of the college basketball market is that there are a lot of smart people who also bet on it. Scraping some easily sourced data, dumping it into a XGBoostRegressor model, and betting the results isn't enough to win. The true difference in performance was realized through creating my own statistics. Take a look at this public repo I made to show what went into creating a player level stat that, to be quite honest, didn't contain much signal at all: Basketball Utils. This stat is publicly available, but I needed to retroactively calculate it for historical games using my own data.
Creating my own efficiency metrics and tempo was the most important part of the feature equation. If you are interested Bart Torvik's FAQ contains a detailed breakdown of how he calculates these metrics. Working from this, I created my own efficiency ratings and team tempo calculations. I then could create point in time records of each of the teams and have relatively complete control over the most important parts of my feature set. You can view my rankings here: Team Rankings
Finding a way to account for injuries in the historical data was also a challenge, and something I iterated on quite a few times until settling for what I think is a decent way of accomplishing it.
Admitting that the betting market should be a part of my model was a long process, but one that I currently accept. It took some time to work out what that meant for my model and process, but I am now at a relatively confident place with how I blend the two together.
Oftentimes when working on some potential feature, a new idea pops into my head and I drop it into a google doc of TODO's. The reality is that 98% of the ideas don't contain any signal, and it is a long trial and error process to find something new and useful.
Note: I am trying to give insight without totally giving away what I am doing. I don't want to necessarily spell out everything that I bake into my model.
Nuances of Betting Markets
Something that might not be well known to casual bettors or those just learning about the space is that sportsbooks don't actually know what the betting line on a game truly should be. The reality of the current state of the betting market is that there are a few real sportsbooks (primarily based outside of the U.S.) such as Pinnacle, BetCris, and Bookmaker. Within the U.S. there is Circa Sports, as well as a few new sportsbooks offering an exchange type model. I call these real sportsbooks because they do not ban or limit winning bettors. The fact is, if you are a winning sports bettor playing in a regulated market in the U.S. on a sportsbook not named Circa Sports (or one of the new betting exchanges), you will eventually be shown the door, or more likely a severely restricted bet limit (think $5).
Without getting into the weeds, these real sportsbooks are able to more efficiently move lines. These books operate somewhat similar to the stock market. Although bookmaking is part art, part science, and something I have only a surface level understanding of. If you are interested in learning more, Jeffrey Benson of Circa Sports, has a great thread on X that gets into more detail here: Benson's Tweet
The takeaway here is that a betting line will move from least efficient when it opens (for college basketball that is usually 18-24 hours before tipoff) to most efficient right before tipoff. Here is an example of what this process could look like for Illinois vs. Penn State. At 5 P.M. the night before Pinnacle would post a betting line of Illinois -8. This is called the opener. As a result of the types of bets that are being made on Pinnacle, they move the line all the way to -4, each time moving the line a half point at a time. That means the betting market moves from Illinois winning by 8 all the way down to Illinois winning by 4. This move could be gradual or relatively quick. We know that lines are more efficient at close and this can be confirmed by examining historical error metrics at those respective points in time. So without even considering a model, we can be confident that a bet at Penn St. +8 is a great bet and in the long run will make you money. The same is true at +7.5 and all the way up to around +5. Just going off of the number alone, it requires a bit more digging to say whether a single point of value on a game is enough to win in the long run in college basketball. That is analysis for another time. Getting a better line than the close is called getting closing line value, or CLV, and a great way to check whether you are on the right track when it comes to modeling sports.
Okay so now that we know that there are only a few sportsbooks putting real lines up, what does that mean? Well that means that one way to make money is to just find serious discrepancies between these sites and a regulated U.S. site. This is called top down betting and is a methodology used by many professional sports bettors.
The reality of creating a sports betting model is that eventually you will need to bet your opinion into the market. It would be naive to ignore the information that the market is providing you. If your model is projecting a total of 160 and the line at Pinnacle is 140, there is something wrong with your model. It is important to go back to the drawing board if discrepancies like this are popping up. I had to do this several times. Once the obvious errors are corrected and predictions rarely deviate too far from closing lines, there are a handful of approaches to bake in market information. All of which I built into my testing pipeline. You could regress your number to the market number by a certain percentage. 20% is a typical approach. This number could account for how close a game is to tipping off. Another option is to include the market number as a feature within the model. However, this might lead to a number that rarely differs from the betting line, especially if you use the closing line. Blending the opening and closing line models was another idea I tested out. This is a part of the problem I am interested in exploring a bit more this offseason.
All of this to say, it is important to at the very least reference the betting data the market is giving you. Use real books, like the ones listed above, as your benchmark, and then go out and find the best numbers and prices available in your region.
Productionizing a Model
As I realized that a single python notebook file wasn't going to cut it anymore, I quickly moved to a much more organized approach. Functions were organized into classes and data was moved into databases as necessary. This change coincided with the start of my career as a software engineer, making it increasingly painful to work with the mess of a codebase I had initially started over 4 years ago.
Now, in my first season with the current system, it has taken me a few different variations over the past few years to finally get it to what it is now. For the most part, I am happy with how it has performed this season and don't see myself making any significant changes going into next year.
My model and pipelines currently run on Google Cloud. In hindsight I probably should have chosen AWS, but when I first moved to the cloud I was still in school and Google gave me more free credits so I went with them :).
I have now moved to using some “Pseudo APIs” or unofficial APIs, for some of my raw data, and do a small amount of scraping for injury data.
Here is a diagram explaining the basic flow of my pipeline:
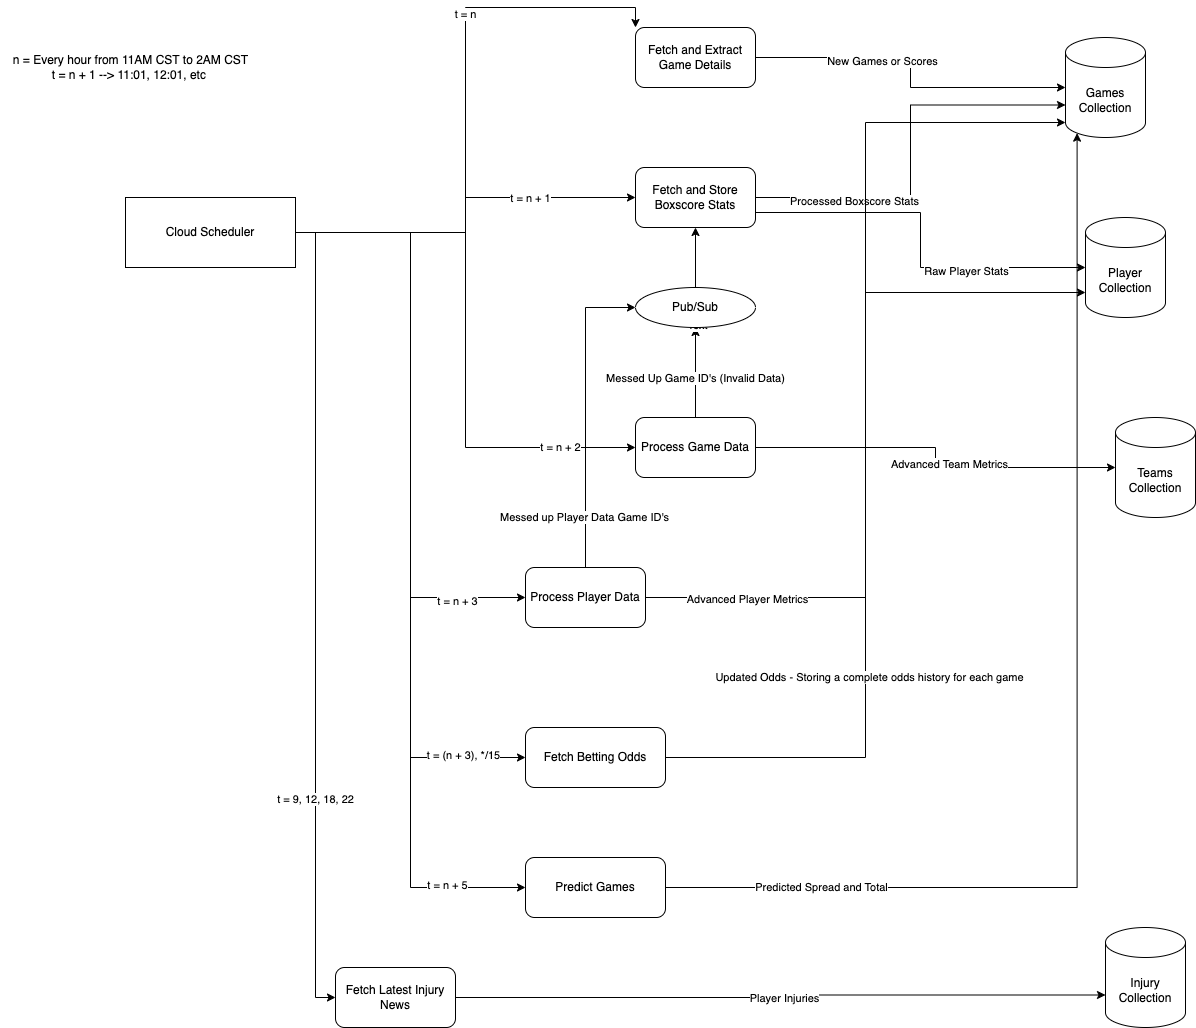
I started adding in some more lines to show how each function interacts with the databases to perform the respective processing, but the whole diagram got a bit too crowded. In general, rectangles labeled with “Fetch” are cloud functions that gather, clean, and store raw data. These functions utilize some official APIs, unofficial APIs, as well as scraping. Rectangles labeled with “Processing”, on the other hand, are responsible for the heavy lifting: they take the raw data and transform it into statistics. These include custom metrics for teams and players, publicly available stats, custom rankings, and the features used in my models.
By the time I am at the prediction stage I need to pull data from each collection to formulate that final prediction. Initially, I was considering using a feature store, but as of right now the data size is quite manageable with the current setup.
The reality of using a system like this with multiple pseudo-api's and some web scraping jumbled together is that regardless of the number of try-except blocks and reprocessing functions I put into the code, there will always be leaks. I am constantly checking the logs to make sure that everything is getting processed as expected, but multiple times I have had to go in and update sections or manually correct data errors that were caused by “providers”. This is all fine and dandy but there comes a point at which the maintenance, combined with the actual work of betting, starts to become quite the burden. This is a hobby project, and while I enjoy the process, I do put my real money behind the output of this model. Assuming I keep the pipeline and processing system similar to what it is now I know that everything will become more robust, but it has required a good amount of upkeep in order to make sure everything is running smoothly.
I did some work to identify whether retraining my model in-season, with a full retraining after each day, made a significant difference in the performance. It turns out it does make a difference when it comes to my spread model, the head to head one, but not a significant difference in the total model. The way I accomplish this is a bit hacky, and could use a reworking but for now it does the trick. There is another cloud function not listed in the diagram which runs once a day to create a dataframe with relevant features and associated target (the win/loss margin of the game) for the given day. This data gets shipped off to a Google storage bucket where it is stored with the date in the name. Next all of the data pkls are downloaded, (as I write this out I am cringing at how inefficient this is) aggregated, and merged with the historical training training data, and used to retrain the current model with the tuned hyperparameters I found during the initial run of tuning during pre season. That model gets pickled and shipped back out to the same storage bucket into my model directory where it is then downloaded prior to each prediction run.
Depending on how the betting market is moving my predictions might also move. Because of this, I am constantly looking for updated betting data in the market and rerunning predictions, updating if there are any non-significant changes to my numbers. My predictions currently update on the hour, but if I have some free time I might choose to manually kick off the pipeline. The result of this is a steadily evolving number.
Although I have automated the majority of the process, there are still house rules which prohibit automatically placing wagers. Given that I risk my real money on this and it is not my full time job, I also feel much more comfortable manually making the final decision of whether to wager or not. To keep this higher-level, the general rule of thumb for betting my number into the market is when I have a ≥ 1.5 point difference. So if my model is predicting a total of 140, and Fanduel is offering 138. I would almost certainly wager over 138. To try and remove as much bias as possible the only thing I consider before placing that bet is if I am getting the best price available to me in the market, and whether I think the line will move with or against me. Predicting line movement is an art and something I have only a basic understanding of. Generally if I see a better price available at an offshore book that I respect, I can be somewhat confident that a legal book - Draftkings, Fanduel, Caesars, etc , will move their line to mirror that number and price shortly. This tells me I am better off waiting and placing the wager if and when that line moves.
Why the Juice May Not Be Worth the Squeeze
If you have read to this point, you might be thinking this all sounds like a lot of work. You would be correct. Or perhaps you think I am an idiot who has wasted his time overcomplicating a trivial problem. I am not counting the latter thought totally out at this stage.
I just spent a great deal of time outlining how I built a sports betting model. Now I would like to steelman why you might not want to spend time on a problem like this.
Remember when I said that almost every legal sportsbook within the United States does not want winning bettors? Well the inevitable end to a great betting model is figuring out how to scale on the betting side. Assuming you have a fresh account and have not shown a track record of winning long term. Here is a scenario which you will soon become accustomed with: Deposit $10,000 into an account with the goal of winning. Over the course of a week you identify 20 bets in which you have an edge. A few a day, so you bet $500 - $1000 on those games. You pick off some really bad lines in the open, so you bet big on those. After those 20 games you are actually down $1500. They were great bets, you got amazing CLV on the games, but those 5%+ edges that you found didn't pan out. No problem you think, over a long enough sample size you know that you are gonna make money. The week starts up and you go to place some more bets. But when you go to place your first wager you are shown a nice little message: “Bet Declined, Stake is greater than maximum allowed $50”. You lost money and still got limited. Maybe you won money, the reality is you just lost one of only a handful of legal places you have to bet. Welcome to the first of many brutal truths of sports betting. Learning how to win is just the beginning. Professional sports bettor Spanky has an entire podcast episode dedicated to this. Anyone seriously considering pursuing sports betting beyond a recreational level should give the episode a listen and consider if they are willing to put up with this reality.
Okay so now you burned accounts - burned in this instance means your bet sizing is limited - on your legal books, what does that leave you with? Now you have a few options, all of which are legally questionable. You could open up an account at an offshore sports betting site. Prior to legalization that is what most of America had to do. Here you will see similar issues with regards to limiting, but there are some reputable sites who will welcome your action without you having to worry about being limited. Chances are, especially if you are just beginning your modeling journey, you CANNOT win on these sites. Their lines are too sharp and if you can win, your edge will be lower than what you had on your local, legal sportsbook. You could also try and find an account on a PPH book, but that's not worth diving into.
Let's dive into the economics of betting, particularly if you are only going to be betting on your model. College basketball is a great sport to bet on because of the volume of games. While the limits on games may be lower, this shouldn't be an issue when you are just getting started. For a brief moment imagine a world in which you do not get limited for placing bets that a sportsbook deems are sharp. Consider that you on average win around 55% of your bets on spreads and totals with an average price of -110. This number is quite high and something more realistic would be 53-54%, especially if you were going for volume, but for the sake of this example let's use 55%. As a general rule of thumb we can go ahead and stake 1% of our bankroll on any given bet. Let's also be generous and give ourselves a $10,000 bankroll. Okay so for any given bet we are going to be placing a $100 wager and we can expect that on average over 100 bets we will win 55 at 55 * (100/110) * 100 = $5k in winnings - 45 * 100 = $4.5k in losses = net $500. Or to make things simpler, we can just think that over the long run, each bet is going to net us $5, in other words we have an expected value of $5 on each bet. Wow, $5 for just clicking a button is not bad you think, and if we do that 1000 times that's 5 grand, that's some decent money. The reality of the situation is that you are at the mercy of variance. You could go out place 20 bets and lose all 20 of them. Are you mentally prepared to lose $2000 in two days? Do you have the confidence to wake up that next day and place another $1500 dollars in bets? It’s easy to look at the theoretical ROI of your model, but the reality of waking up each day and wagering money like this is that it can take you for a ride if you let it. Setting emotions aside, which is much easier said than done, consider the value of your time. You spent a hundred hours building a model, pipeline, data integrity checks, backtesting, finetuning and now you are ready to make some money! For each bet you place you need to view an odd’s screen - something every professional bettor uses and every bettor should be using - you need to make sure your numbers line up with what you are seeing in the market, then you need to go open up the respective app or website and go and manually place that bet. For one bet that’s not too bad, but scale that by 20 or so and do that multiple times a day, and you now have a part time job. Oh and that expected value calculation you came to earlier, that is theoretical, nothing in sports betting is guaranteed. So there's a solid chance you put in 5 hours of work, looking at numbers for teams you can’t believe existed, only to lose $1000.
Consider that you also have a full-time job, you are competing against people who make a living betting sports. When major news breaks and a key player is injured, they can get ahead of the market and adjust their positions accordingly. Maybe you noticed something wrong in one of your processing functions, it might take a few hours to get it working. Maybe it takes you a week to fix the issue, that's a whole week worth of betting in an already limited season that you missed out on.
Why Do I Spend Time Working on This Problem?
Writing the list of reasons not to pursue modeling sports was surprisingly easy. There were a lot of lessons learned throughout the years that made it onto that list. To be honest, I think I could write 5 more bullet points about why this is so brutal. Importantly, you are setting yourself up to enter a world with some real shady characters. While it's changing, sports betting tends to attract a great deal of charlatans, scammers, and degenerates.
But….for whatever reason I have found the problem to be incredibly interesting. Almost everyday during the offseason as soon as my workday was over, I eagerly made my way to my computer and got to work on ideas I had thought out for my model. Part of this passion was due to my friends being invested in the model. What started as me publishing picks to a spreadsheet evolved to a full on website, which I use daily to find betting opportunities. That site is used by my friends who then share with others and I have a steady stream of daily visitors. Nothing to brag about, but it has spread entirely by word of mouth.
I often get more enjoyment of hearing from friends that my site made them money than seeing my own profits.
Now that this season is coming to an end I have begun to think about what is next. My first goal was to put some thoughts I had on this journey to the screen. This may be for no reason other than that I think it will be interesting to look back on at some point down the road and reflect. As for my sports betting work, I debated moving onto more markets. It's quite tempting, but I struggle to justify it. What is holding me back from pursuing sports more is how this problem does not truly scale. If this were the stock market there would be an essentially unlimited potential for the work I put in. Sports betting is exactly the opposite. Compared to financial markets, sports are miniscule, and there is an entire network of betting partnerships that are required to be able to get relative size (money) on a given game. I do not think I am ready to make that commitment at this time. I have many other ideas, outside of betting, that I think need to be explored at the moment.
I am not ready to bid farewell to college basketball just yet though. I have a laundry list of ideas specific to college basketball that I know will eat at me, which I will return to soon. For now, I am looking forward to enjoying March Madness as a fan - with a few +EV wagers sprinkled in. Then I think it's time I took a stab at some LLM work
If you read all the way here, thanks!
Jonah